Kubernetes operators seem to be everywhere these days. There are hundreds of them available to install in your cluster. Operators manage everything from X.509 certificates to enterprise-y database deployments, service meshes, and monitoring stacks. But why add even more complexity to a system that many say is already convoluted? With an operator controlling cluster resources, if you have a bug, you now have two problems: figuring out which of the myriad of Kubernetes primitives is causing the issue, as well as understanding how that dang operator is contributing to the problem!
So when I proposed the idea of introducing a custom-built operator into our Cloud infrastructure stack, I knew that I had to really sell it as a true benefit to the company, so people wouldn't think that I was spending my time on a piece of RDD vaporware. After the go-ahead to begin the project, I spent my days learning about Kubernetes internals, scouring the internet far and wide to find content about operator development, and writing (and rewriting) the base of what was to become our QuestDB Cloud operator.
After many months of hard work, we've finally deployed this Kubernetes operator into our production Cloud. Building on top of our existing 'one-shot-with-rollback' provisioning model, the operator adds new functionality that allows us to perform complex operations like automatically recovering from node failure, and will also orchestrate upcoming QuestDB Enterprise features such as High Availability and Cold Storage.
If we've done my job correctly, you, as a current or potential end user will continue to enjoy the stability and easy management of your growing QuestDB deployments, without noticing a single difference. This is the story of how we accomplished this engineering feat and why we even did it in the first place.
Original System Architecture
To manage customer instances in our cloud, we use a queue-based system that is able to provision databases across different AWS accounts and regions using a centralized control plane known simply as "the provisioner."
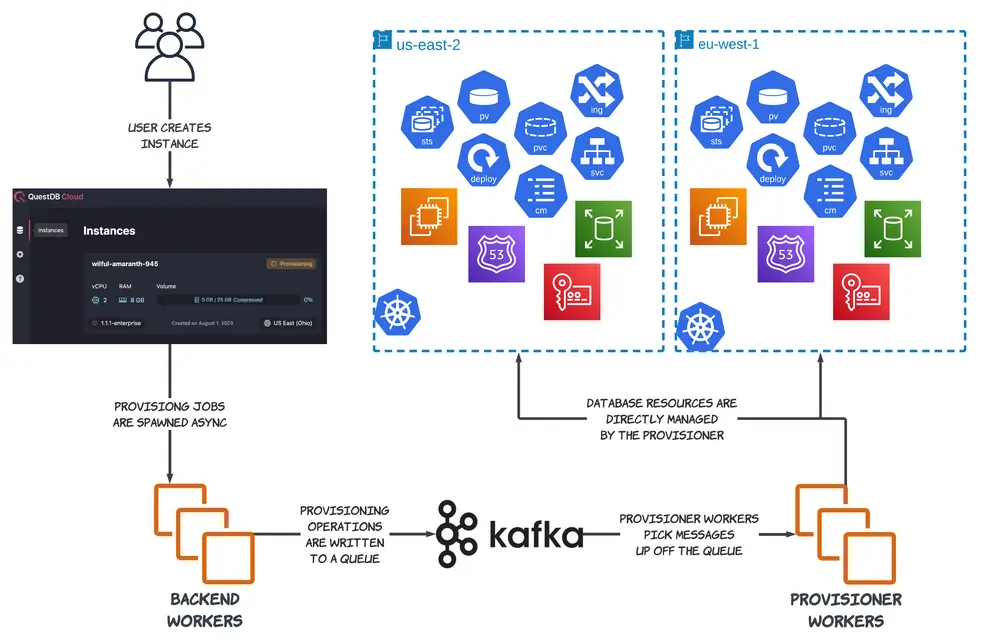
When a user creates, modifies, or deletes a database in the QuestDB Cloud, an application backend server asynchronously sends a message that describes the change to a backend worker, which then appends that message to a Kafka log. Each message contains information about the target database (its unique identifier, resident cluster, and information about its config, runtime, and storage) as well as the specific set of operations that are to be performed.
These instructional messages get picked up by one of many provisioner workers, each of which subscribes to a particular Kafka log partition. Once a provisioner worker receives a message, it is decoded and its instructions are carried out inside the same process. Instructions vary based on the specific operation that needs to be performed. These range from simple tasks like an application-level restart, to more complex ones such as tearing down an underlying database's node if the user wants to pause an active instance to save costs on an unused resource.
Each high-level instruction is broken down into smaller, composable granular tasks. Thus, the provisioner coordinates resources at a relatively low level, explicitly managing k8s primitives like StatefulSets, Deployments, Ingresses, Services, and PersistentVolumes as well as AWS resources like EC2 Instances, Security Groups, Route53 Records, and EBS Volumes.
Provisioning progress is reported back to the application through a separate Kafka queue (we call it the "gossip" queue). Backend workers are listening to this queue for new messages, and update a customer database's status in our backend database when new information has been received.
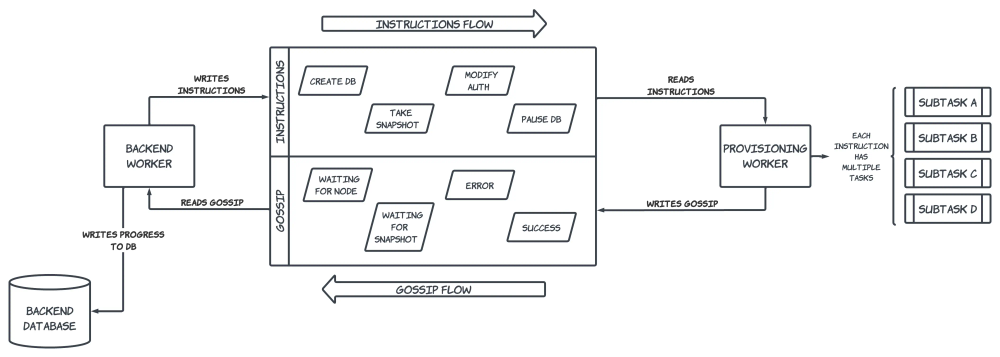
Each granular operation also has a corresponding rollback procedure in case the provisioner experiences an error while running a set of commands. These rollbacks are designed to leave the target database's infrastructure in a consistent state, although it's important to note that this is not the desired state as intended by the end user's actions. Once an error has been encountered and the rollback executed, the backend will be notified about the original error through the gossip Kafka queue in order to surface any relevant information back to the end user. Our internal monitoring system will also trigger alerts on these errors so an on-call engineer can investigate the issue and kick off the appropriate remediation steps.
While this system has proven to be reliable over the past several months since we first launched our public cloud offering, the framework still leaves room for improvement. Much of our recent database development work around High Availability and Cold Storage requires adding more infrastructure components to our existing system. And adding new components to any distributed system tends to increase the system's overall error rate.
As we continue to add complexity to our infrastructure, there is a risk that the above rollback strategy won't be sufficient enough to recover from new classes of errors. We need a more responsive and dynamic provisioning system that can automatically respond to faults and take proactive remediation action, instead of triggering alerts and potentially waking up one of our globally-distributed engineers.
This is where a Kubernetes operator can pick up the slack and improve our existing infrastructure automation.
Introducing a Kubernetes Operator
Now that stateful workloads have started to mature in the Kubernetes ecosystem, practitioners are writing operators to automate the management of these workloads. Operators that handle full-lifecycle tasks like provisioning, snapshotting, migrating, and upgrading clustered database systems have started to become mainstream across the industry.
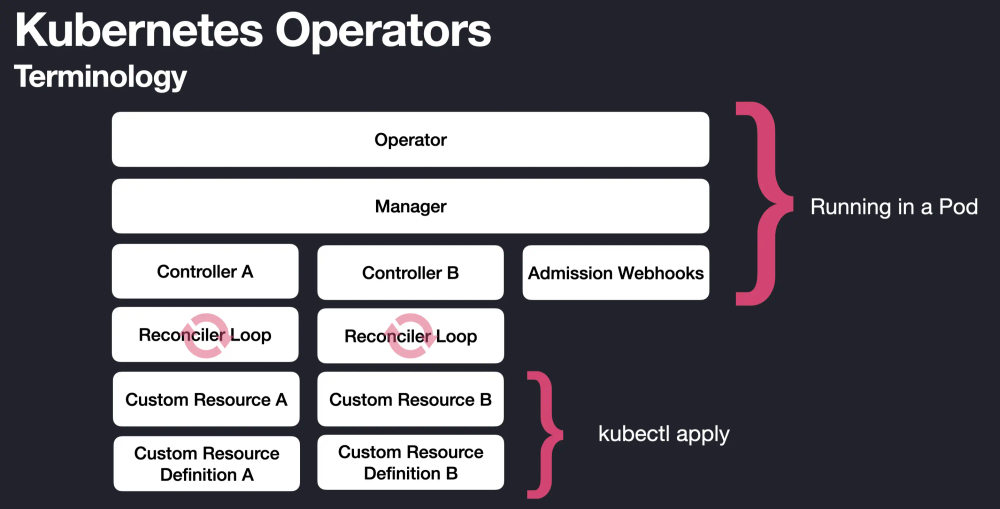
These operators include Custom Resource Definitions (CRDs) that define new types of Kubernetes API resources which describe how to manage the intricacies of each particular database system. Custom Resources (CRs) are then created from these CRDs that effectively define the expected state of a particular database resource. CRs are managed by operator controller deployments that orchestrate various Kubernetes primitives to migrate the cluster state to its desired state based on the CR manifests.
By writing our own Kubernetes operator, I believed, we could take advantage of this model by allowing the provisioner to only focus on higher-level tasks, while an operator handles the nitty-gritty details of managing each individual customer database. Since an operator is directly hooked in to the Kubernetes API server through Resource Watches, it can immediately react to changes in cluster state and constantly reconcile cluster resources to achieve the desired state described by a Custom Resource spec. This allows us to automate even more of our infrastructure management, since the control plane is effectively running all of the time, instead of only during explicit provisioning actions.
With an operator deployed in one of our clusters, we can now interact with a customer database by executing API calls and CRUD operations against a single resource, a new Custom Resource Definition that represents an entire QuestDB Cloud deployment. This CRD allows us to maintain a central Kubernetes object that represents the canonical version of the entire state of a customer's QuestDB database deployment in our cluster. It includes fields like the database version, instance type, volume size, server config, and the underlying node image, as well as key pieces of status like a node's IP address and DNS record information. Based on these spec field values, as well as changes to them, the operator performs a continuous reconciliation of all the relevant Kubernetes and AWS primitives to match the expected state of the higher-level QuestDB construct.
New Architecture
This leads us to our new architecture:
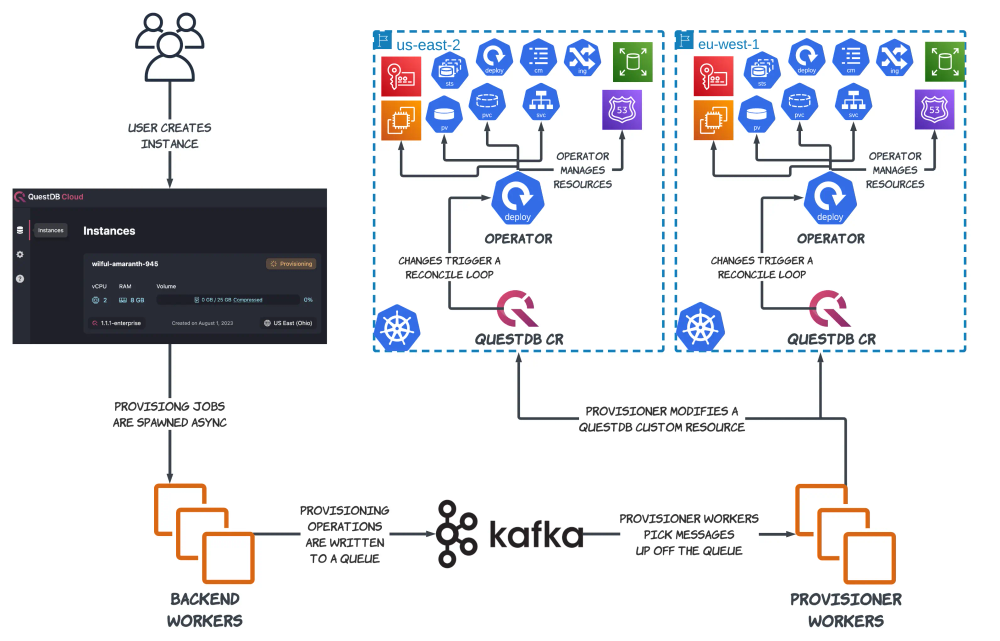
While this diagram resembles the old one, there is a key difference here; a QuestDB operator instance is now running inside of each cluster! Instead of the provisioner being responsible for all of the low-level Kubernetes and AWS building blocks, it is now only responsible for modifying a single object: a QuestDB Custom Resource. Any modifications to the state of a QuestDB deployment, large or small, can be made by changing a single manifest that describes the desired state of the entire deployment.
This solution still uses the provisioner, but in a much more limited capacity than before. The provisioner continues to act as the communication link between the application and each tenant cluster, and it is still responsible for coordinating high-level operations. But, it can now delegate low-level database management responsibilities to the operator's constantly-running reconciliation loops.
Operator Benefits
Auto-Healing
Since the operator model is eventually-consistent, we no longer need to rely on rollbacks in the face of errors. Instead, if the operator encounters an error in its reconciliation loop, it re-attempts that reconciliation at a later time, using an exponential backoff by default.
The operator is registered to Resource Watches for all QuestDBs in the cluster, as well as for their subcomponents. So, a change in any of these components, or the QuestDB spec itself, will trigger a reconciliation loop inside the operator. If a component is accidentally mutated or experiences some state drift, the operator will be immediately notified of this change and automatically attempt to bring the rest of the infrastructure to its desired state.
This property is incredibly useful to us, since we provision a dedicated node for each database and use a combination of taints and NodeSelectors to ensure that all of a deployment's Pods are running on this single node. Due to these design choices, we are now exposed to the risk of a node hardware failure that renders it inaccessible. Typical Kubernetes recovery patterns can not save us.
So instead of using an alerting-first remediation paradigm, where on-call engineers would follow a runbook after receiving an alert that a database is down, the operator allows us to write custom node failover logic that is triggered as soon as the cluster is aware of an unresponsive node. Now, our engineers can sleep soundly through the night while the operator automatically performs the remediation steps that they would previously be responsible for.
Simpler Provisioning
Instead of having to coordinate tens of individual objects in a typical operation, the provisioner now only has to modify a single Kubernetes object while executing higher level instructions. This dramatically reduces the code complexity inside of the provisioner codebase and makes it far easier for us to write unit and integration tests. It is also easier for on-call engineers to quickly diagnose and solve issues with customer databases, since all of the relevant information about a specific database is contained inside of a single Kubernetes spec manifest, instead of spread across various resource types inside each namespace. Although, as expressed in the previous point, hopefully there will be fewer problems for our on-call engineers to solve in the first place!
Easier Upgrades
The 15-week Kubernetes release cadence can be a burden for smaller infrastructure teams to keep on top of. This relatively rapid schedule, combined with the short lifetime of each release, means that it is critical for organisations to keep their clusters up-to-date. The importance of this is magnified if you're not running your own control plane, since vendors tend to drop support for old k8s versions fairly quickly.
Since we're running each database on its own node, and there are only two of us to manage the entire QuestDB Cloud infrastructure, we could easily spend most of our time just upgrading customer database nodes to new Kubernetes versions. Instead, our operator now allows us to automatically perform a near-zero-downtime node upgrade with a single field change on our CRD.
Once the operator detects a change in a database's underlying node image, it will handle all of the orchestration around the upgrade, including keeping the customer database online for as long as possible and cleaning up stale resources once the upgrade is complete. With this automation in place, we can now perform partial upgrades against subsets of our infrastructure to test new versions before rolling them out to the entire cluster, and also seamlessly roll back to an older node version if required.
Control Plane Locality
By deploying an operator-per-cluster, we can improve the time it takes for provisioning operations to complete by avoiding most cross-region traffic that takes place from the provisioner to remote tenant clusters. We only need to make a few cross-region API calls to kickstart the provisioning process by performing a CRUD operation on a QuestDB spec, and the local cluster operator will handle the rest. This improves our API call network latency and reliability, reducing the number of retries for any given operation as well as the overall database provisioning time.
Resource Coordination
Now that we have a single Kubernetes resource to represent an entire QuestDB deployment, we can use this resource as a primitive to build even larger abstractions. For example, now we can easily create a massive (but temporary) instance to crunch large amounts of data, save that data to a PersistentVolume in the cluster, then spin up another smaller database to act as the query interface. Due to the inherent composability of Kubernetes resources, the possibilities with a QuestDB Custom Resource are endless!
The DevOps Stuff
Testing the Operator
Before deploying such a significant piece of software in our stack, I wanted to be as confident as possible in its behavior and runtime characteristics before letting it run wild in our clusters. So we wrote and ran a large series of unit and integration tests before we felt confident enough to deploy the new infrastructure to development, and eventually to production.
Unit tests were written against an in-memory Kubernetes API server using the controller-runtime/pkg/envtest library. Envtest allowed us to iterate quickly since we could run tests against a fresh API cluster that started up in around 5 seconds instead of having to spin up a new cluster every time we wanted to run a test suite. Even existing micro-cluster tools like Kind could not get us that level of performance. Since envtest is also not packaged with any controllers, we could also set our test cluster to a specific state and be sure that this state would not be modified unless we explicitly did so in our test code. This allowed us to fully test specific edge-cases without having to worry about control plane-level controllers modifying various objects out from underneath us.
But unit testing is not enough, especially since many of the primitives that we are manipulating are fairly high-level abstractions in and of themselves. So we also spun up a test EKS cluster to run live tests against, built with the same manifests as our development and production environments. This cluster allowed us run tests using live AWS and K8s APIs, and was integral when testing features like node recovery and upgrades.
We were also able to leverage Ginkgo's parallel testing runtime to run our integration tests on multiple concurrent processes. This provided multiple benefits: we could run our entire integration test suite in under 10 minutes and also reuse the same suite to load test the operator in a production-like environment. Using these tests, we were able to identify hot spots in the code that needed further optimization and experimented with ways to save API calls to ease the load on our own Kubernetes API server while also staying under various AWS rate limits. It was only after running these tests over and over again that I felt confident enough to deploy the operator to our dev and prod clusters.
Monitoring
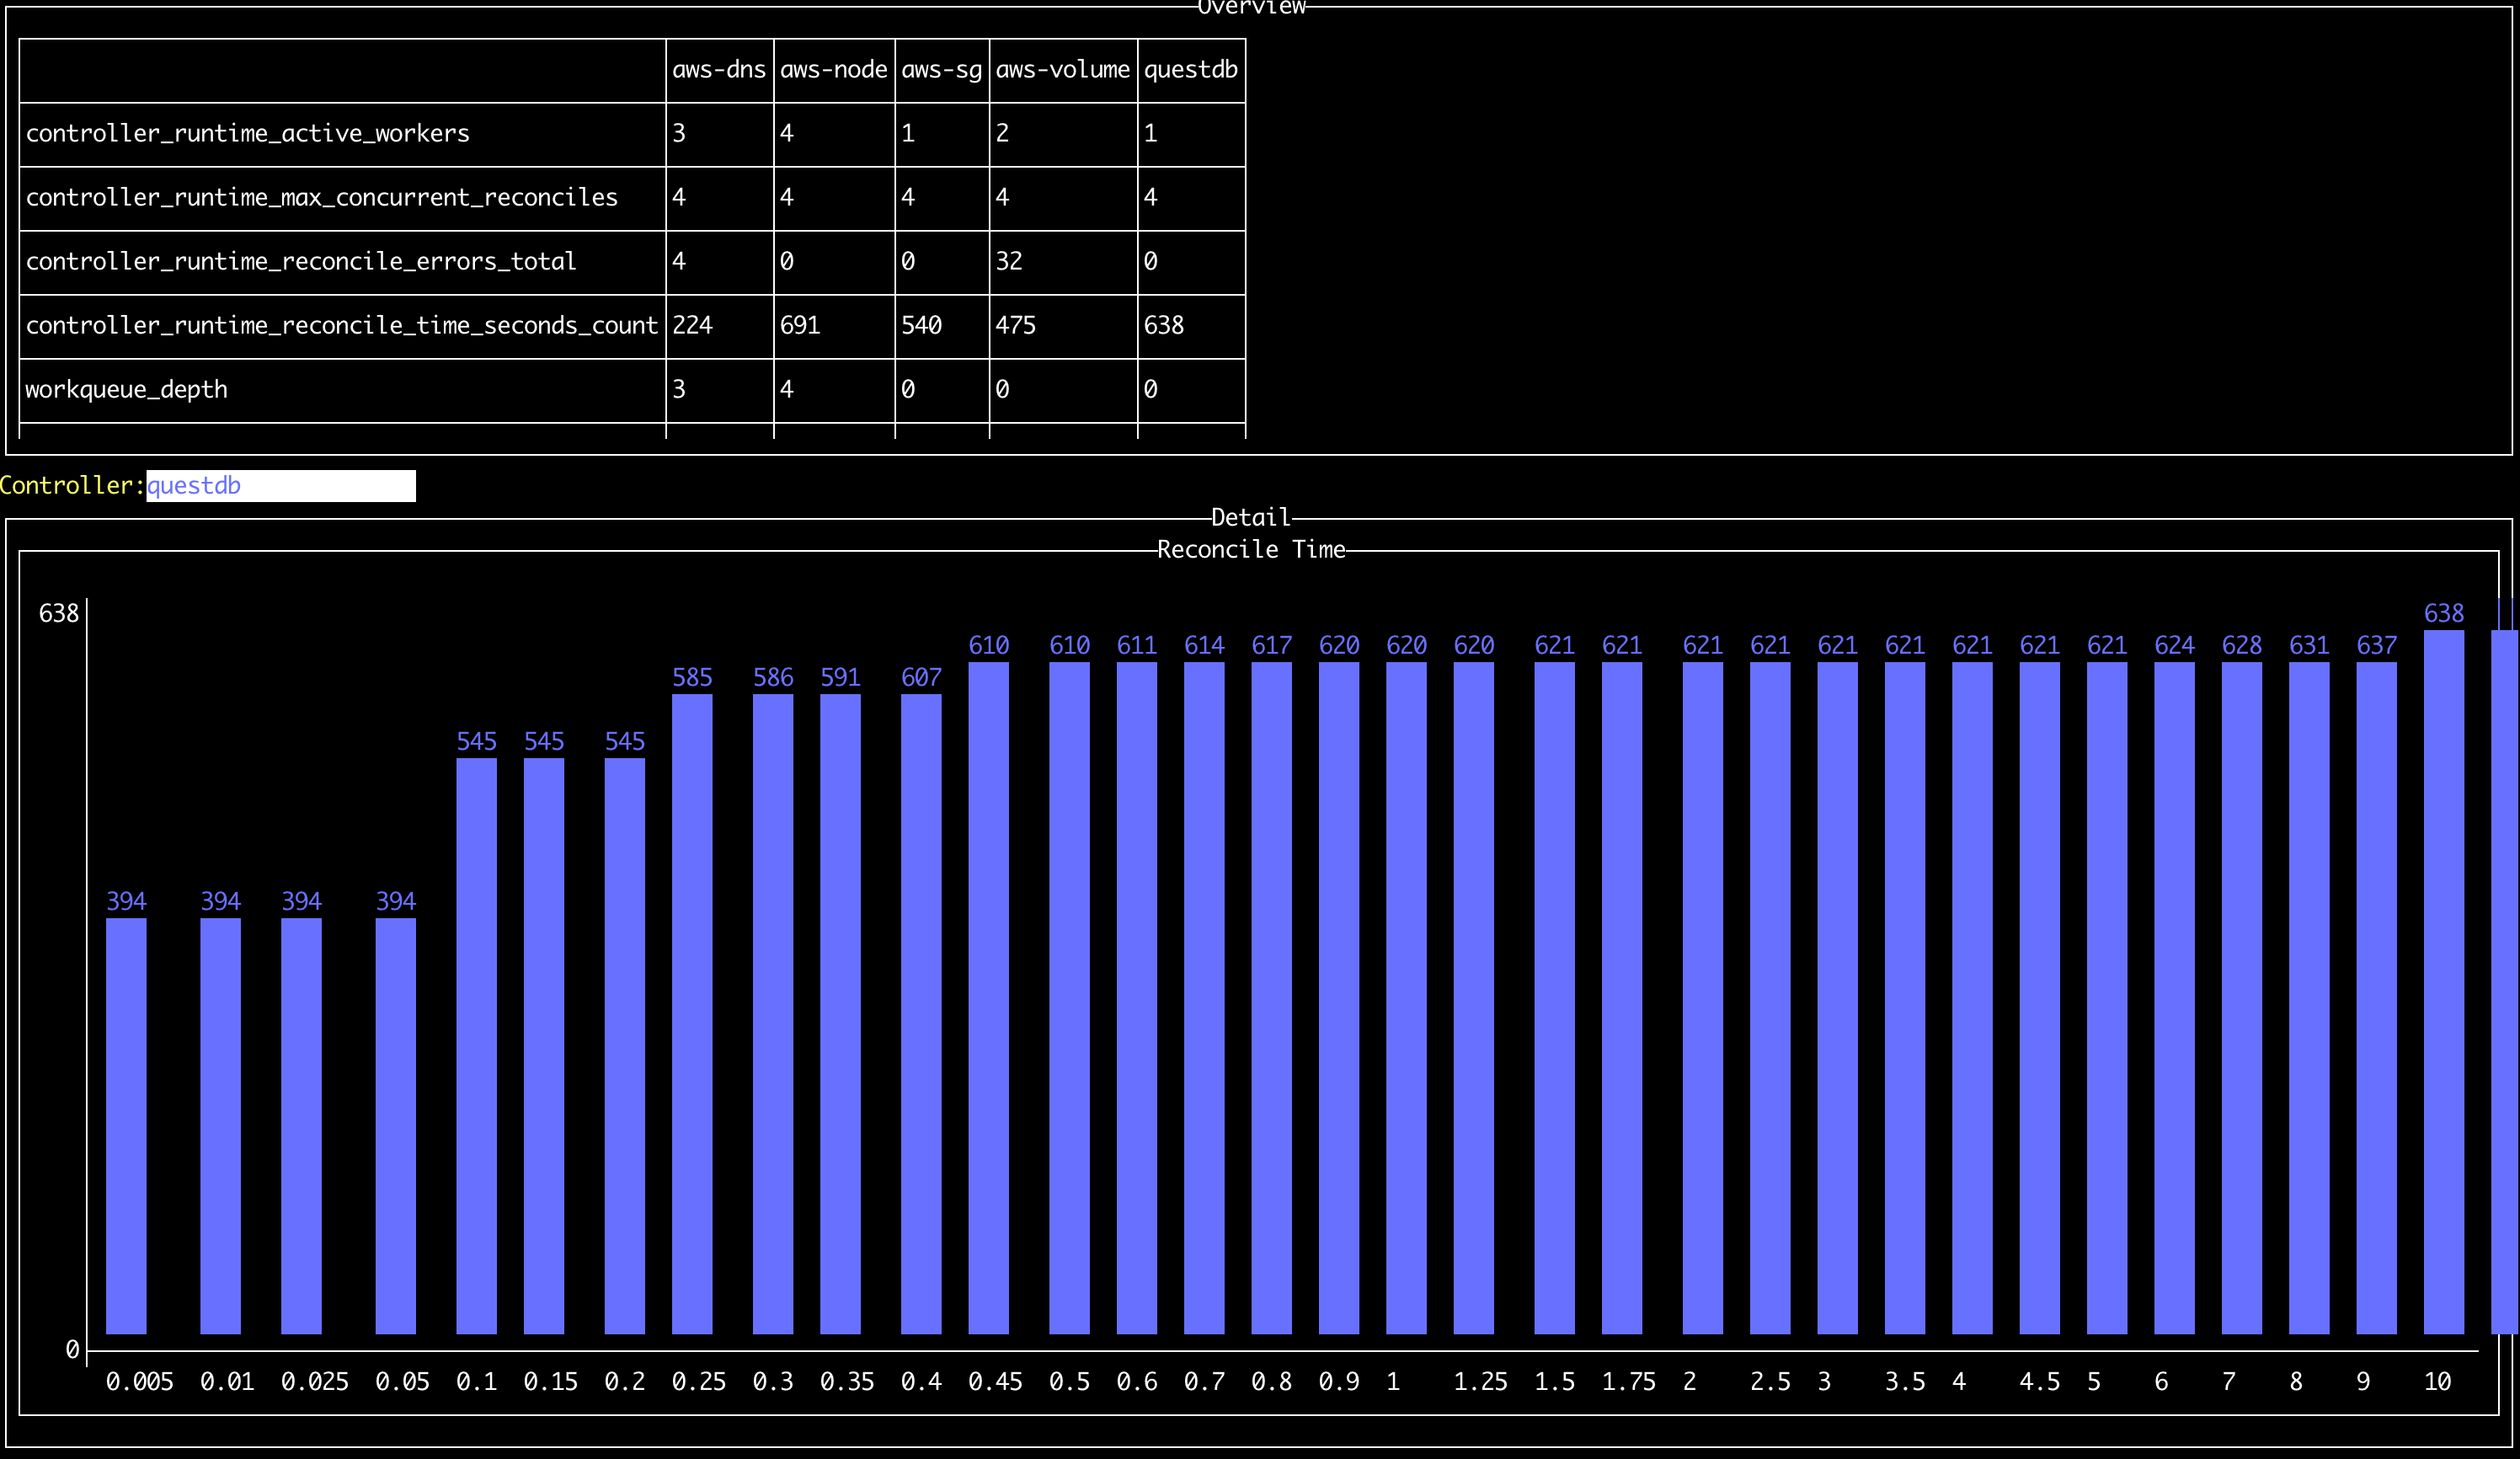
Since we built our operator using the Kubebuilder framework, most standard monitoring tasks were handled for us out-of-the-box. Our operator automatically exposes a rich set of Prometheus metrics that measure reconciliation performance, the number of k8s API calls, workqueue statistics, and memory-related metrics. We we were able to ingest these metrics into pre-built dashboards by leveraging the grafana/v1-alpha plugin, which scaffolds two Grafana dashboards to monitor Operator resource usage and performance. All we had to do was add these to our existing Grafana manifests and we were good to go!
Migrating to the New Paradigm
No article about a large infrastructure change would be complete without a discussion about the migration strategy from old to the new. In our case, we designed the operator to be a drop-in-replacement for the database instances managed by the provisioner. This involved many tedious rounds of diffing yaml manifests to ensure that the resources coordinated by the operator would match the ones that were already in our cluster.
Once this resource parity was reached, we utilized Kubernetes owner-dependent relationships to create an Owner Reference on each sub-resource that pointed to the new QuestDB Custom Resource. Part of the reconciliation loop involves ensuring that these ownership references are in place, and if not, are created automatically. This way, the operator can seamlessly "inherit" legacy resources through its main reconciliation codepath.
We were able to roll this out incrementally due to the guarantee that the operator cannot make any changes to resources that are not owned by a QuestDB CR. Because of this property, we could create a single QuestDB CR and monitor the operator's behavior on only the cluster resources associated with that database. Once everything behaved as expected, we started to roll out additional Custom Resources. This could be easily controlled on the provisioner side; by checking for the existence of a QuestDB CR for a given database. If the CR existed, then we could be sure that we were dealing with an operator-managed instance, otherwise the provisioner would behave as it did before the operator existed.
Conclusion
I'm extremely proud of the hard work that we've put into this project. Starting from an empty git repo, it's been a long journey to get here. There have been several times over the past few months when I questioned if all of this work was even worth the trouble, especially since we already had a provisioning system that was battle-tested in production. But with the support of my colleagues, I powered through to the end. And I can definitely say that it's been worth it, as we've already seen immediate benefits of moving to this new paradigm!
Using our QuestDB CR as a building block has paved the way for new features like adding a large-format bulk CSV upload with our SQL COPY command. The new node upgrade process will save us countless hours with every new k8s release. And even though we haven't experienced a hardware failure yet, I'm confident that our new operator will seamlessly handle that situation as well, without paging up an on-call engineer. Especially since we are a small team, it is critical for us to use automation as a force-multiplier that assists us in managing our Cloud infrastructure, and a Kubernetes operator provides us with next-level automation that was previously unattainable.
Originally posted on the QuestDB Blog