If you work with persistent storage in Kubernetes, maybe you've seen articles about how to migrate from in-tree to CSI volumes, but aren't sure what all the fuss is about? Or perhaps you're trying to debug a stuck VolumeAttachment that won't unmount from a node, holding up your important StatefulSet rollout? A clear understanding of what the Container Storage Interface (or CSI for short) is and how it works will give you confidence when dealing with persistent data in Kubernetes, allowing you to answer these questions and more!
The Container Storage Interface is an API specification that enables developers to build custom drivers which handle the provisioning, attaching, and mounting of volumes in containerized workloads. As long as a driver correctly implements the CSI API spec, it can be used in any supported Container Orchestration system, like Kubernetes. This decouples persistent storage development efforts from core cluster management tooling, allowing for the rapid development and iteration of storage drivers across the cloud native ecosystem.
In Kubernetes, the CSI has replaced legacy in-tree volumes with a more flexible means of managing storage mediums. Previously, in order to take advantage of new storage types, one would have had to upgrade an entire cluster's Kubernetes version to access new PersistentVolume API fields for a new storage type. But now, with the plethora of independent CSI drivers available, you can add any type of underlying storage to your cluster instantly, as long as there's a driver for it.
But what if existing drivers don't provide the features that you require and you want to build a new custom driver? Maybe you're concerned about the ramifications of migrating from in-tree to CSI volumes? Or, you simply want to learn more about how persistent storage works in Kubernetes? Well, you're in the right place! This article will describe what the CSI is and detail how it's implemented in Kubernetes.
It's APIs All the Way Down
Like many things in the Kubernetes ecosystem, the Container Storage Interface is actually just an API specification. In the container-storage-interface/spec GitHub repo, you can find this spec in 2 different versions:
- A protobuf file that defines the API schema in gRPC terms
- A markdown file that describes the overall system architecture and goes into detail about each API call
What I'm going to discuss in this section is an abridged version of that markdown file, while borrowing some nice ASCII diagrams from the repo itself!
Architecture
A CSI Driver has 2 components, a Node Plugin and a Controller Plugin. The Controller Plugin is responsible for high-level volume management; creating, deleting, attaching, detatching, snapshotting, and restoring physical (or virtualized) volumes. If you're using a driver built for a cloud provider, like EBS on AWS, the driver's Controller Plugin communicates with AWS HTTPS APIs to perform these operations. For other storage types like NFS, EXSI, ZFS, and more, the driver sends these requests to the underlying storage's API endpoint, in whatever format that API accepts.
On the other hand, the Node Plugin is responsible for mounting and provisioning a volume once it's been attached to a node. These low-level operations usually require privileged access, so the Node Plugin is installed on every node in your cluster's data plane, wherever a volume could be mounted.
The Node Plugin is also responsible for reporting metrics like disk usage back to the Container Orchestration system (referred to as the "CO" in the spec). As you might have guessed already, I'll be using Kubernetes as the CO in this post! But what makes the spec so powerful is that it can be used by any container orchestration system, like Nomad for example, as long as it abides by the contract set by the API guidelines.
The specification doc provides a few possible deployment patterns, so let's start with the most common one.
                             CO "Master" Host
+-------------------------------------------+
|                                           |
|  +------------+           +------------+  |
|  |     CO     |   gRPC    | Controller |  |
|  |            +----------->   Plugin   |  |
|  +------------+           +------------+  |
|                                           |
+-------------------------------------------+

                            CO "Node" Host(s)
+-------------------------------------------+
|                                           |
|  +------------+           +------------+  |
|  |     CO     |   gRPC    |    Node    |  |
|  |            +----------->   Plugin   |  |
|  +------------+           +------------+  |
|                                           |
+-------------------------------------------+

Figure 1: The Plugin runs on all nodes in the cluster: a centralized
Controller Plugin is available on the CO master host and the Node
Plugin is available on all of the CO Nodes.
Since the Controller Plugin is concerned with higher-level volume operations, it does not need to run on a host in your cluster's data plane. For example, in AWS, the Controller makes AWS API calls like ec2:CreateVolume, ec2:AttachVolume, or ec2:CreateSnapshot to manage EBS volumes. These functions can be run anywhere, as long as the caller is authenticated with AWS. All the CO needs is to be able to send messages to the plugin over gRPC. So in this architecture, the Controller Plugin is running on a "master" host in the cluster's control plane.
On the other hand, the Node Plugin must be running on a host in the cluster's data plane. Once the Controller Plugin has done its job by attaching a volume to a node for a workload to use, the Node Plugin (running on that node) will take over by mounting the volume to a well-known path and optionally formatting it. At this point, the CO is free to use that path as a volume mount when creating a new containerized process; so all data on that mount will be stored on the underlying volume that was attached by the Controller Plugin. It's important to note that the Container Orchestrator, not the Controller Plugin, is responsible for letting the Node Plugin know that it should perform the mount.
Volume Lifecycle
The spec provides a flowchart of basic volume operations, also in the form of a cool ASCII diagram:
   CreateVolume +------------+ DeleteVolume
 +------------->|  CREATED   +--------------+
 |              +---+----^---+              |
 |       Controller |    | Controller       v
+++         Publish |    | Unpublish       +++
|X|          Volume |    | Volume          | |
+-+             +---v----+---+             +-+
                | NODE_READY |
                +---+----^---+
               Node |    | Node
            Publish |    | Unpublish
             Volume |    | Volume
                +---v----+---+
                | PUBLISHED  |
                +------------+

Figure 5: The lifecycle of a dynamically provisioned volume, from
creation to destruction.
Mounting a volume is a synchronous process: each step requires the previous one to have run successfully. For example, if a volume does not exist, how could we possibly attach it to a node?
When publishing (mounting) a volume for use by a workload, the Node Plugin first requires that the Controller Plugin has successfully published a volume at a directory that it can access. In practice, this usually means that the Controller Plugin has created the volume and attached it to a node. Now that the volume is attached, it's time for the Node Plugin to do its job. At this point, the Node Plugin can access the volume at its device path to create a filesystem and mount it to a directory. Once it's mounted, the volume is considered to be published and it is ready for a containerized process to use. This ends the CSI mounting workflow.
Continuing the AWS example, when the Controller Plugin publishes a volume, it calls ec2:CreateVolume followed by ec2:AttachVolume. These two API calls allocate the underlying storage by creating an EBS volume and attaching it to a particular instance. Once the volume is attached to the EC2 instance, the Node Plugin is free to format it and create a mount point on its host's filesystem.
Here is an annotated version of the above volume lifecycle diagram, this time with the AWS calls included in the flow chart.
   CreateVolume +------------+ DeleteVolume
 +------------->|  CREATED   +--------------+
 |              +---+----^---+              |
 |       Controller |    | Controller       v
+++         Publish |    | Unpublish       +++
|X|          Volume |    | Volume          | |
+-+                 |    |                 +-+
                    |    |
 <ec2:CreateVolume> |    | <ec2:DeleteVolume>
                    |    |
 <ec2:AttachVolume> |    | <ec2:DetachVolume>
                    |    |
                +---v----+---+
                | NODE_READY |
                +---+----^---+
               Node |    | Node
            Publish |    | Unpublish
             Volume |    | Volume
                +---v----+---+
                | PUBLISHED  |
                +------------+
If a Controller wants to delete a volume, it must first wait for the Node Plugin to safely unmount the volume to preserve data and system integrity. Otherwise, if a volume is forcibly detatched from a node before unmounting it, we could experience bad things like data corruption. Once the volume is safely unpublished (unmounted) by the Node Plugin, the Controller Plugin would then call ec2:DetachVolume to detatch it from the node and finally ec2:DeleteVolume to delete it, assuming that the you don't want to reuse the volume elsewhere.
What makes the CSI so powerful is that it does not prescribe how to publish a volume. As long as your driver correctly implements the required API methods defined in the CSI spec, it will be compatible with the CSI and by extension, be usable in COs like Kubernetes and Nomad.
Running CSI Drivers in Kubernetes
What I haven't entirely make clear yet is why the Controller and Node Plugins are plugins themselves! How does the Container Orchestrator call them, and where do they plug into?
Well, the answer depends on which Container Orchestrator you are using. Since I'm most familiar with Kubernetes, I'll be using it to demonstrate how a CSI driver interacts with a CO.
Deployment Model
Since the Node Plugin, responsible for low-level volume operations, must be running on every node in your data plane, it is typically installed using a DaemonSet. If you have heterogeneous nodes and only want to deploy the plugin to a subset of them, you can use node selectors, affinities, or anti-affinities to control which nodes receive a Node Plugin Pod. Since the Node Plugin requires root access to modify host volumes and mounts, these Pods will be running in privileged mode. In this mode, the Node Plugin can escape its container's security context to access the underlying node's filesystem when performing mounting and provisioning operations. Without these elevated permissions, the Node Plugin could only operate inside of its own containerized namespace without the system-level access that it requires to provision volumes on the node.
The Controller Plugin is usually run in a Deployment because it deals with higher-level primitives like volumes and snapshots, which don't require filesystem access to every single node in the cluster. Again, lets think about the AWS example I used earlier. If the Controller Plugin is just making AWS API calls to manage volumes and snapshots, why would it need access to a node's root filesystem? Most Controller Plugins are stateless and highly-available, both of which lend themselves to the Deployment model. The Controller also does not need to be run in a privileged context.
Event-Driven Sidecar Pattern
Now that we know how CSI plugins are deployed in a typical cluster, it's time to focus on how Kubernetes calls each plugin to perform CSI-related operations. A series of sidecar containers, that are registered with the Kubernetes API server to react to different events across the cluster, are deployed alongside each Controller and Node Plugin. In a way, this is similar to the typical Kubernetes controller pattern, where controllers react to changes in cluster state and attempt to reconcile the current cluster state with the desired one.
There are currently 6 different sidecars that work alongside each CSI driver to perform specific volume-related operations. Each sidecar registers itself with the Kubernetes API server and watches for changes in a specific resource type. Once the sidecar has detected a change that it must act upon, it calls the relevant plugin with one or more API calls from the CSI specification to perform the desired operations.
Controller Plugin Sidecars
Here is a table of the sidecars that run alongside a Controller Plugin:
| Sidecar Name | K8s Resources Watched | CSI API Endpoints Called |
|---|---|---|
| external-provisioner | PersistentVolumeClaim | CreateVolume,DeleteVolume |
| external-attacher | VolumeAttachment | Controller(Un)PublishVolume |
| external-snapshotter | VolumeSnapshot(Content) | CreateSnapshot,DeleteSnapshot |
| external-resizer | PersistentVolumeClaim | ControllerExpandVolume |
How do these sidecars work together? Let's use an example of a StatefulSet to demonstrate. In this example, we're dynamically provisioning our PersistentVolumes (PVs) instead of mapping PersistentVolumeClaims (PVCs) to existing PVs. We start at the creation of a new StatefulSet with a VolumeClaimTemplate.
---
apiVersion: apps/v1
kind: StatefulSet
spec:
  volumeClaimTemplates:
  - metadata:
      name: www
    spec:
      accessModes: [ "ReadWriteOnce" ]
      storageClassName: "my-storage-class"
      resources:
        requests:
         storage: 1Gi
Creating this StatefulSet will trigger the creation of a new PVC based on the above template. Once the PVC has been created, the Kubernetes API will notify the external-provisioner sidecar that this new resource was created. The external-provisioner will then send a CreateVolume message to its neighbor Controller Plugin over gRPC. From here, the CSI driver's Controller Plugin takes over by processing the incoming gRPC message and will create a new volume based on its custom logic. In the AWS EBS driver, this would be an ec2:CreateVolume call.
At this point, the control flow moves to the built-in PersistentVolume controller, which will create a matching PV and bind it to the PVC. This allows the StatefulSet's underlying Pod to be scheduled and assigned to a Node.
Here, the external-attacher sidecar takes over. It will be notified of the new PV and call the Controller Plugin's ControllerPublishVolume endpoint, mounting the volume to the StatefulSet's assigned node. This would be the equivalent to ec2:AttachVolume in AWS.
At this point, we have an EBS volume that is mounted to an EC2 instance, all based on the creation of a StatefulSet, PersistentVolumeClaim, and the work of the AWS EBS CSI Controller Plugin.
Node Plugin Sidecars
There is only one unique sidecar that is deployed alongside the Node Plugin; the node-driver-registrar. This sidecar, running as part of a DaemonSet, registers the Node Plugin with a Node's kubelet. During the registration process, the Node Plugin will inform the kubelet that it is able to mount volumes using the CSI driver that it is part of. The kubelet itself will then wait until a Pod is scheduled to its corresponding Node, at which point it is then responsible for making the relevant CSI calls (PublishVolume) to the Node Plugin over gRPC.
Common Sidecars
There is also a livenessprobe sidecar that runs in both the Container and Node Plugin Pods that monitors the health of the CSI driver and reports back to the Kubernetes Liveness Probe mechanism.
Communication Over Sockets
How do these sidecars communicate with the Controller and Node Plugins? Over gRPC through a shared socket! So each sidecar and plugin contains a volume mount pointing to a single unix socket.
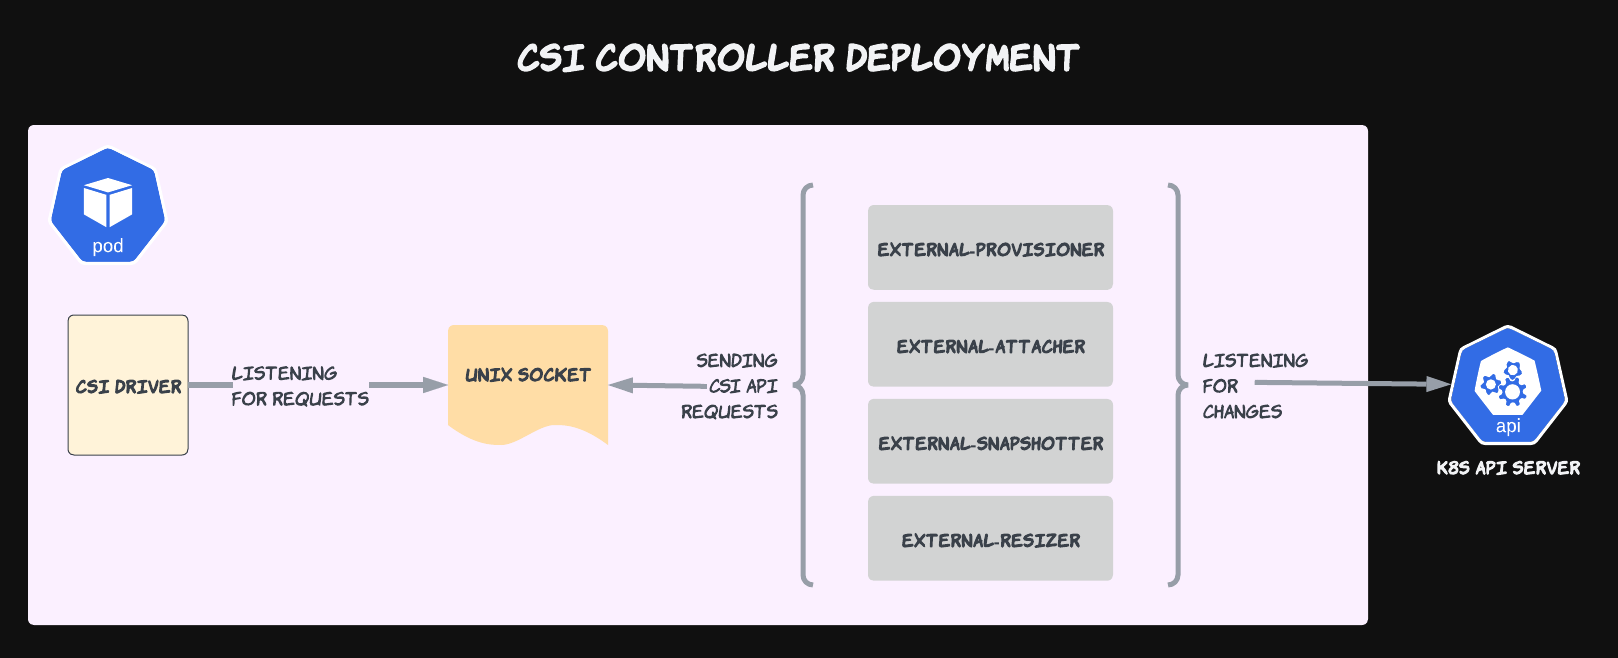
This diagram highlights the pluggable nature of CSI Drivers. To replace one driver with another, all you have to do is simply swap the CSI Driver container with another and ensure that it's listening to the unix socket that the sidecars are sending gRPC messages to. Becase all drivers advertise their own different capabilities and communicate over the shared CSI API contract, it's literally a plug-and-play solution.
Conclusion
In this article, I only covered the high-level concepts of the Container Storage Interface spec and implementation in Kubernetes. While hopefully it has provided a clearer understanding of what happens once you install a CSI driver, writing one requires significant low-level knowledge of both your nodes' operating system(s) and the underlying storage mechanism that your driver is implementing. Luckily, CSI drivers exist for a variety of cloud providers and distributed storage solutions, so it's likely that you can find a CSI driver that already fulfills your requirements. But it always helps to know what's happening under the hood in case your particular driver is misbehaving.
If this article interests you and you want to learn more about the topic, please let me know! I'm always happy to answer questions about CSI Drivers, Kubernetes Operators, and a myriad of other DevOps-related topics.