K8s Operator Prometheus Metrics Viewer
As you hopefully know from reading some of my recent articles, I really enjoy writing Kubernetes operators! I've written a bit about them on this blog, and also just recently presented a talk about how to build them at the inaugural FOSSY conference in Portland, Oregon. So here goes another operator-related article, although this one is about one of the later stages of operator development: performance tuning.
Since I've been working on an operator that includes multiple controllers, each with 4 reconcilers running concurrently that make API calls to resources outside of the cluster, I wanted to start profiling my reconciliation loop performance to ensure that I could handle real-world throughput requirements.
Prometheus Metrics
Kubebuilder offers the ability to export operator-specific Prometheus metrics as part of its default scaffolding. This provides a great way to profile and monitor your operator performance under both testing and live conditions.
Some of these metrics (many on a per-controller basis) include:
- A histogram of reconcile times
- Number of active workers
- Workqueue depth
- Total reconcile time
- Total reconcile errors
- API server request method & response counts
- Process memory usage & GC performance
I wanted a way to monitor these metrics for controllers that are under development on my local machine. This means that they are running as processes outside of any cluster context, which makes it difficult to scrape their exposed metrics using a standard prometheus/grafana setup.
operator-prom-metrics-viewer
So I thought, why not craft a little GUI to display this information? Inspired by the absolutely incredible k9s project, I decided to make a terminal-driven GUI using the tview library.
Since I'm not (yet) storing this information for further analysis, I decided to only display the latest scraped data point for each metric. But I also didn't want to implement my own prometheus metric parser to do this, so I imported pieces of the prometheus scrape library itself to handle the metric parsing. All I had to do was implement a few interfaces for storing and querying my metrics to interop with the scrape library.
Prometheus in-memory, transient storage
The prometheus storage and query interfaces are relatively simple, and it helps that we actually don't need to implement all of their methods!
Storage
The underlying storage mechanism of my InMemoryMetricStorage class is a simple map along with a mutex for locking it during multithreaded IO. In this map, we are only storing the latest value for each metric, so there's no problem overwriting a key's value if it already exists. And we also don't need to worry about out-of-order writes or any other time-series database problems.
type InMemoryAppender struct {
	data map[uint64]DataPoint
	mu   *sync.Mutex
}
The DataPoint struct maps directly to a prometheus metric's structure. If you've worked with prometheus metrics before, this should look pretty familiar to you.
type DataPoint struct {
	Labels    labels.Labels
	Timestamp int64
	Value     float64
}
To populate each DataPoint's uint64 key in the map, we can simply use the prometheus builtin labels.Hash() function to generate a unique key for each DataPoint, without having to do any extra work on our end.
To demonstrate, here's an example of a prometheus metric:
# HELP http_requests_total Total number of http api requests
# TYPE http_requests_total counter
http_requests_total{api="add_product"} 4633433
And how it would be represented by the DataPoint struct:
d := DataPoint{
    Labels: []Label{
        {Name: "api", Value: "add_product"},
    },
    Value: 4633433,
    Timestamp: time.Now(),
}
Now that we have our data model, we need a way to store DataPoints for further retrieval.
Appender
Here's the interface of the storage backend appender:
type Appender interface {
	Append(ref SeriesRef, l labels.Labels, t int64, v float64) (SeriesRef, error)
	Commit() error
	Rollback() error

	ExemplarAppender
	HistogramAppender
	MetadataUpdater
}
Because we're building a simple in-memory tool (with no persistence or availability guarantees), we can ignore the Commit() and Rollback() methods (by turning them into no-ops). Furthermore, we can avoid implementing the bottom three interfaces, since the metrics that are exposed by kubebuilder are not exemplars, metadata, or histograms (the framework actually uses gauges to represent the histogram values, more on this below!). So this only leaves the Append() function to implement, which just writes to the InMemoryAppender's underlying map storage in a threadsafe manner.
func (a *InMemoryAppender) Append(ref storage.SeriesRef, l labels.Labels, t int64, v float64) (storage.SeriesRef, error) {
	a.mu.Lock()
	defer a.mu.Unlock()
	a.data[l.Hash()] = DataPoint{Labels: l, Timestamp: t, Value: v}
	return ref, nil
}
Querier
The querier implementation is also fairly straightforward. We just need to implement a single Query method against our datastore to extract metrics from our store.
My solution is far from an optimized inner-loop; it has awful exponential performance in the worst case. But for looping through a few metrics at a rate of at most once-per-second, I'm not overly concerned with the time-complexity of this function.
func (a *InMemoryAppender) Query(metric string, l labels.Labels) []DataPoint {
	a.mu.Lock()
	defer a.mu.Unlock()

	dataToReturn := []DataPoint{}

	for _, d := range a.data {
		if d.Labels.Get("__name__") != metric {
			continue
		}

		var isMatch bool = true
		for _, label := range l {
			if d.Labels.Get(label.Name) != label.Value {
				isMatch = false
			}
		}

		if isMatch {
			dataToReturn = append(dataToReturn, d)
		}

	}

	return dataToReturn
}
Histogram implementation
Since the controller reconcile time histogram data is stored in prometheus gauges, I did need to write some additional code to transform these into a workable schema to actually generate a histogram. To aid in the construction of the histogram buckets, I created 2 structs, one to represent the histogram itself, and the other to represent each of its buckets.
type HistogramData struct {
	buckets []Bucket
	curIdx  int
}

type Bucket struct {
	Label string
	Value int
}
For each controller, we can run a query against our storage backend for the workqueue_queue_duration_seconds_bucket metric with the name=<controller-name> label. This will return all histogram buckets for a specific controller, each with a separate label (le) that denotes the bucket's limit. We can iterate through these metrics to create Bucket objects, append them to the HistogramData.buckets slice, and eventually sort them before rendering the histogram to keep the display consistent and in the correct order.
The curIdx field on the HistogramData struct is only used internally when rendering the histogram, to keep track of the current index of the buckets slice that we're on. This way, we can consume buckets using a for loop and exit when we return the final bucket. It's a bit clunky, but it works!
v1.0
After all of this hacking, I ended up with something that looks like this:
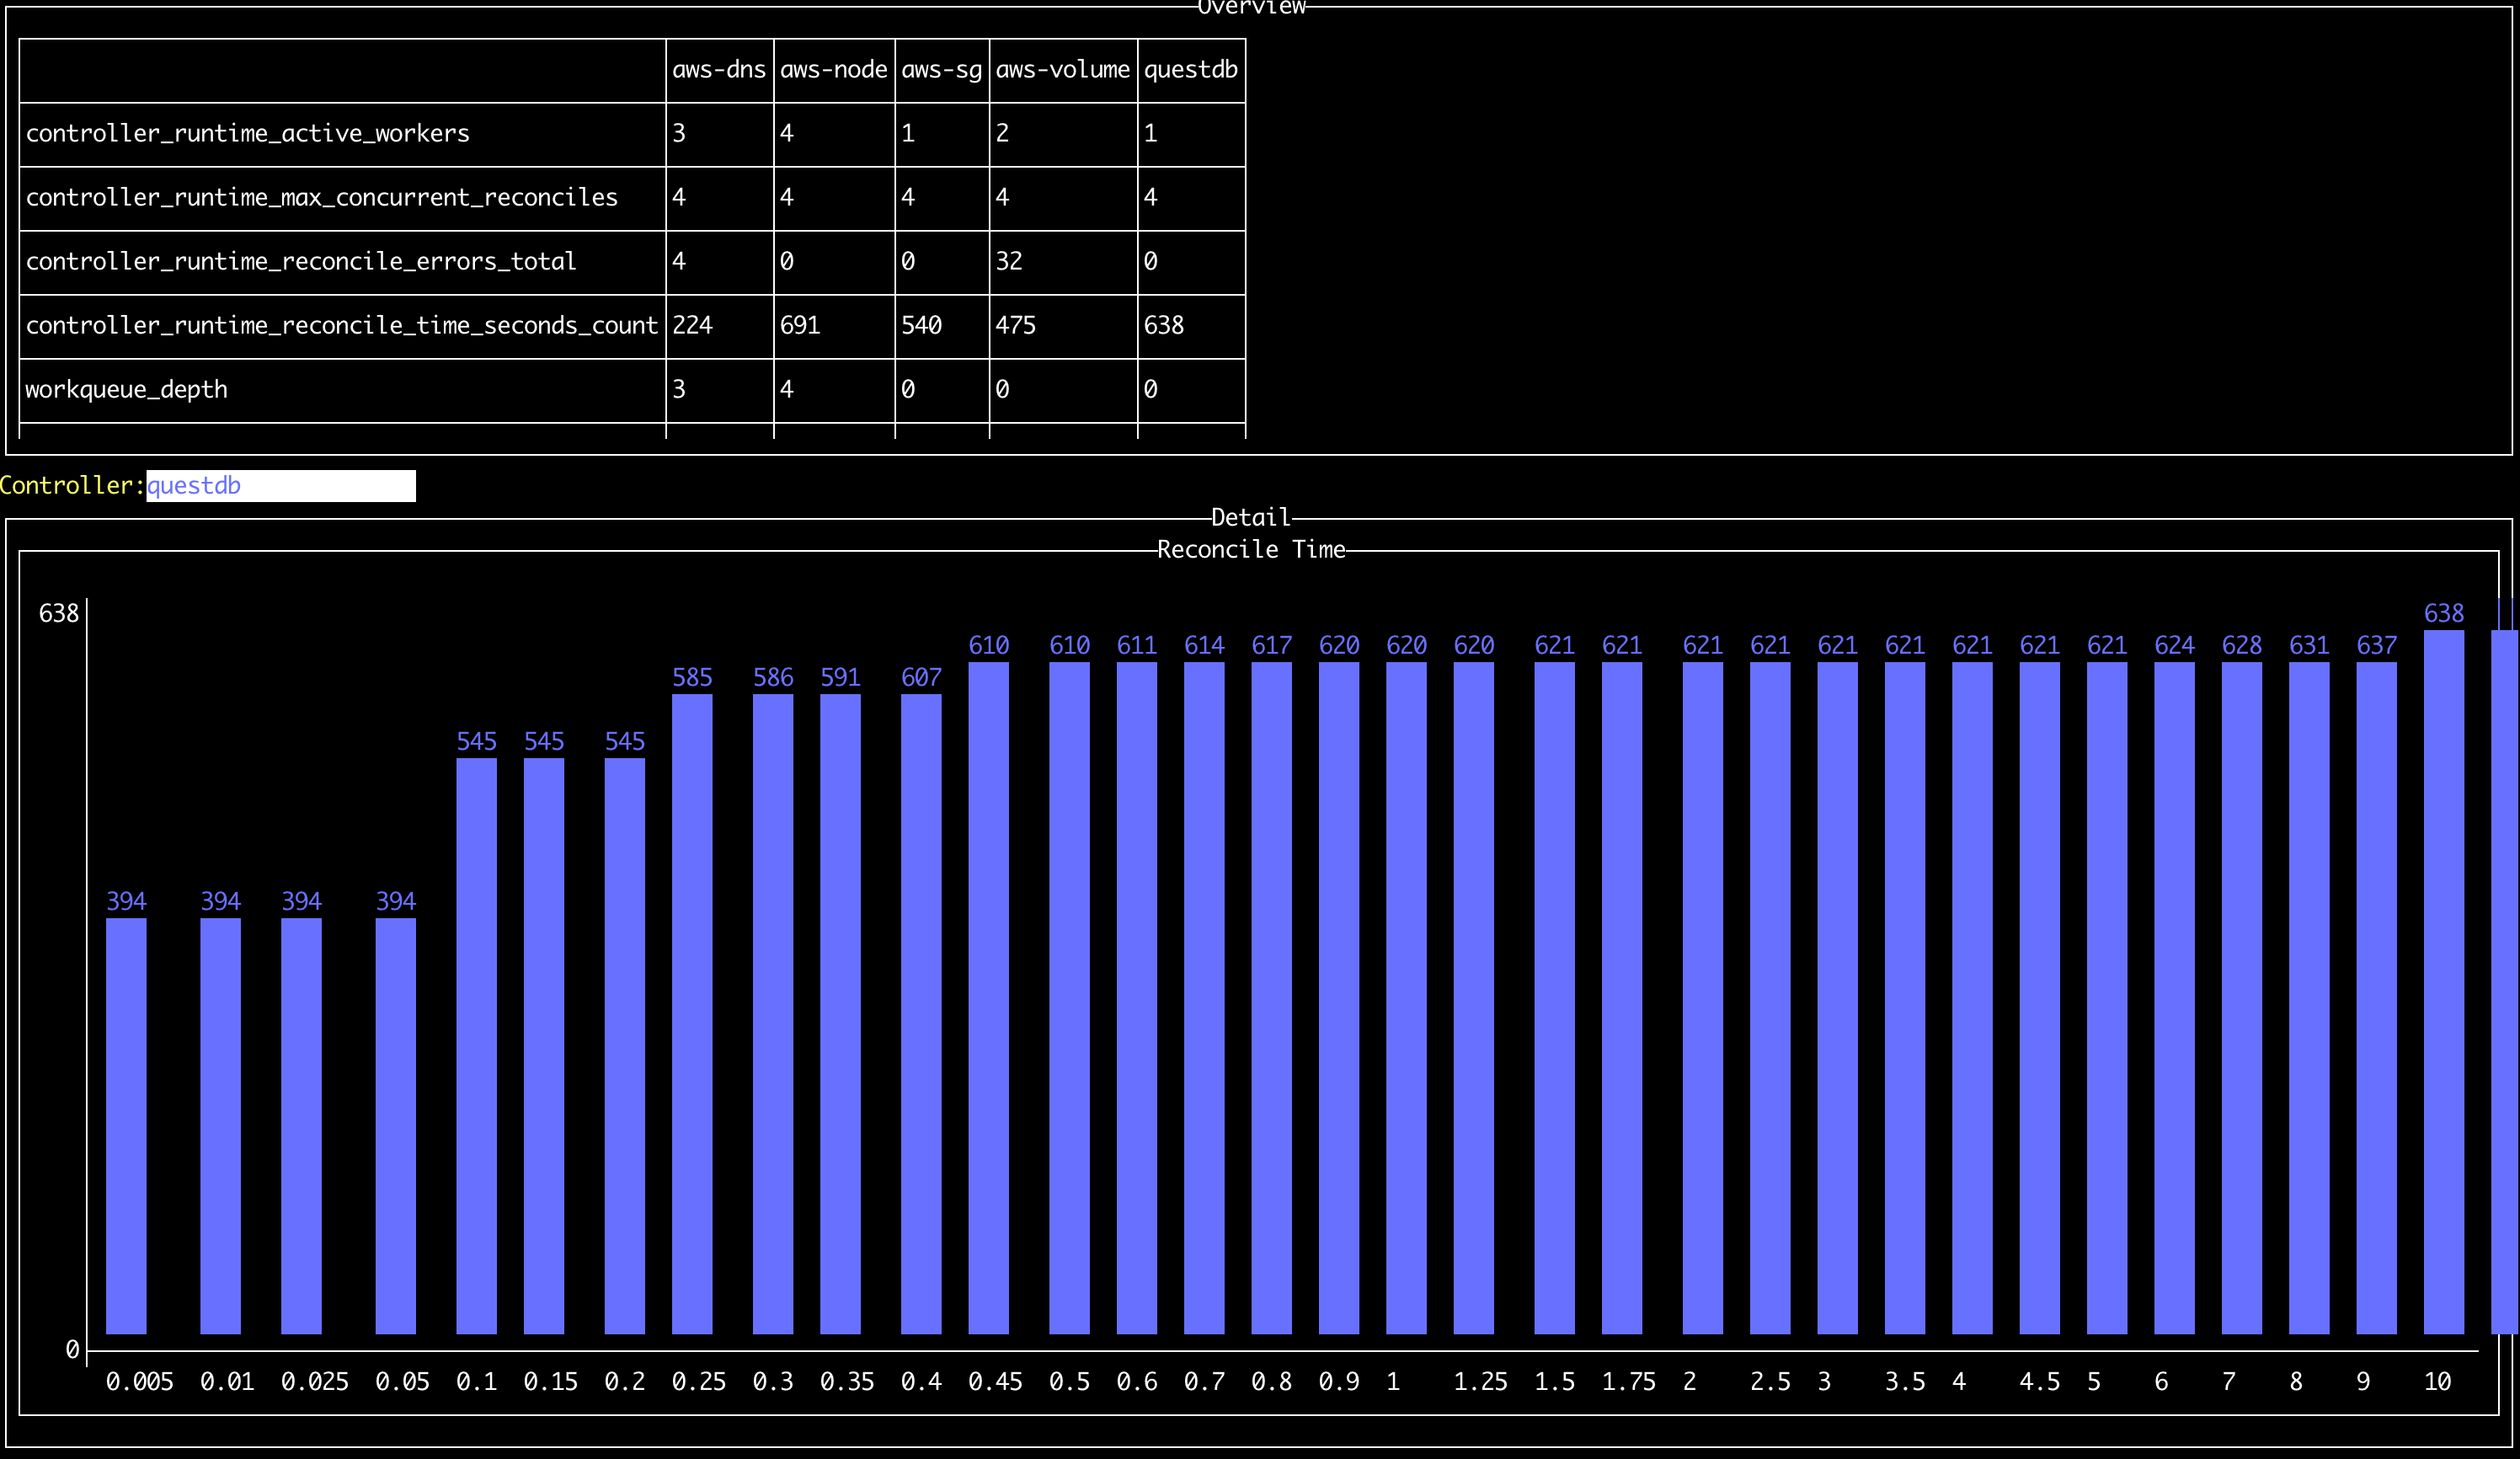
It's far from perfect; since I don't manipulate the histogram values (yet) or have any display scrolling, it's very likely that the histogram will spill off the right of the screen. The UX can also be improved, since you can only switch the controller that is being displayed by pressing the Up and Down buttons.
But it's been a fantastic tool for me when debugging slow reconciles due to API rate limiting, and has also highlighted errors for me when I miss them in the logs. Give it a whirl and let me know what you think!
Link to the Github: https://github.com/sklarsa/operator-prom-metrics-viewer