Originally posted on the QuestDB Blog
Monitoring QuestDB in Kubernetes
As any experienced infrastructure operator will tell you, monitoring and
observability tools are critical for supporting production cloud services.
Real-time analytics and logs help to detect anomalies and aid in debugging,
ultimately improving the ability of a team to recover from (and even prevent)
incidents. Since container technologies are drastically changing the
infrastructure world, new tools are constantly emerging to help solve these
problems. Kubernetes and its ecosystem have addressed the need for
infrastructure monitoring with a variety of newly emerging solutions. Thanks to
the orchestration benefits that Kubernetes provides, these tools are easy to
install, maintain, and use.
Luckily, QuestDB is built with these concerns in mind. From the presence of core
database features to the support for orchestration tooling, QuestDB is easy to deploy
on containerized infrastructure. This tutorial will describe how to use today's
most popular open source tooling to monitor your QuestDB instance running in a
Kubernetes cluster.
Components
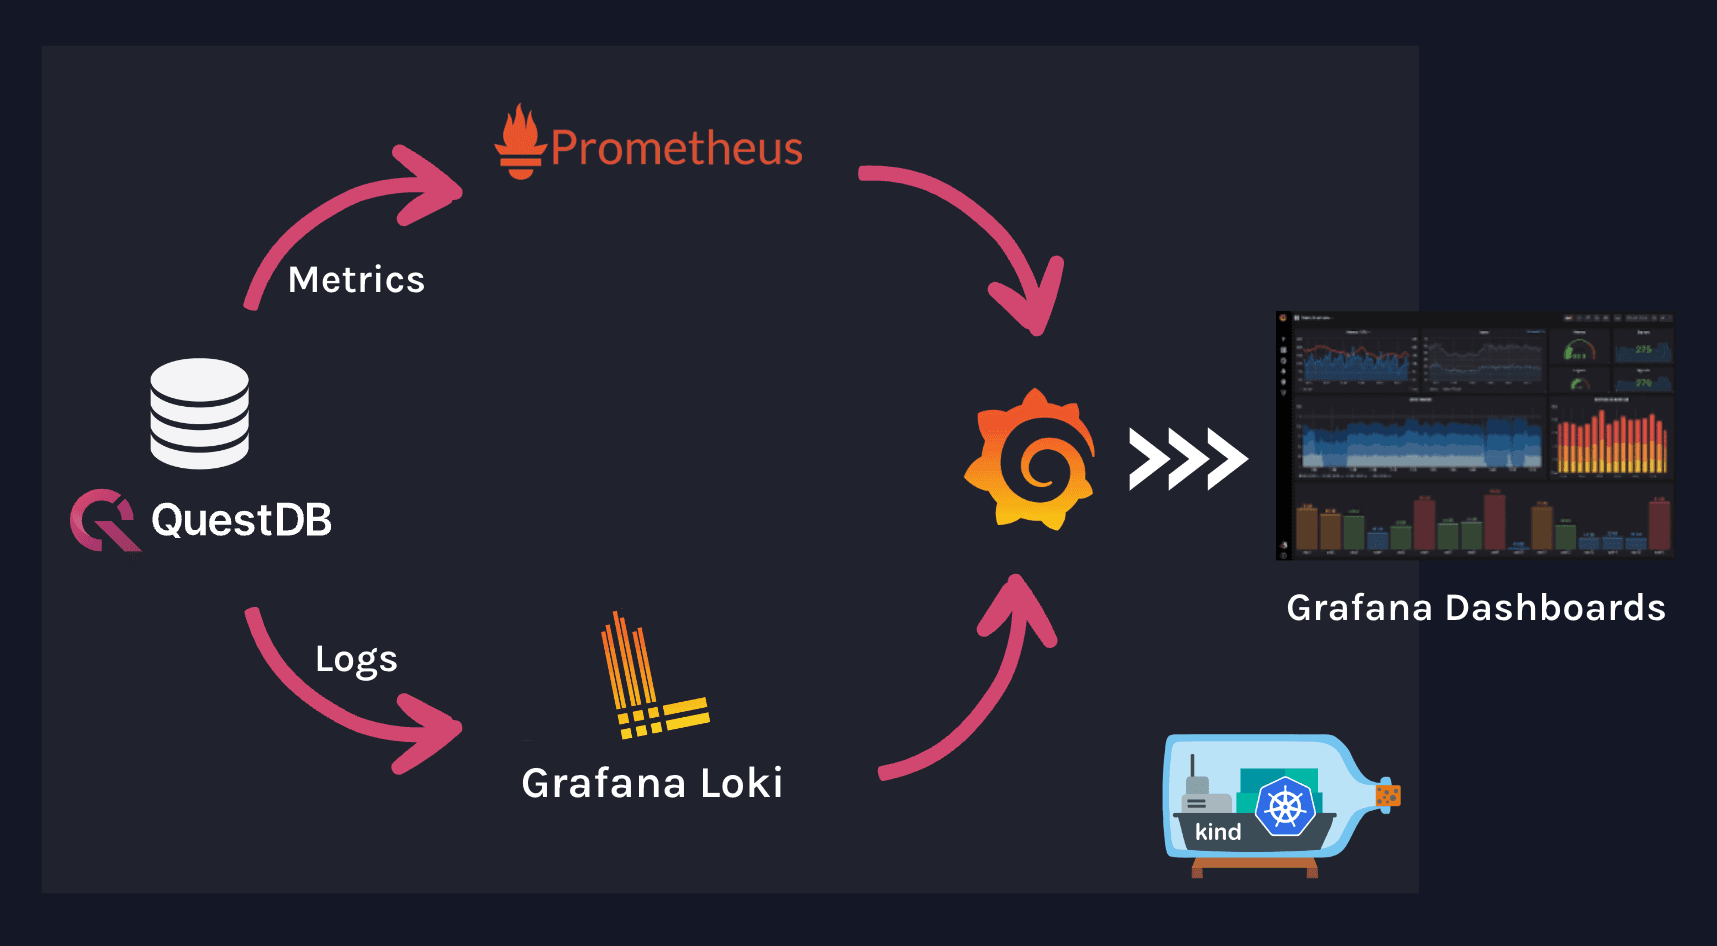
Our goal is to deploy a QuestDB instance on a Kubernetes cluster while also
connecting it to centralized metrics and logging systems. We will be installing
the following components in our cluster:
- A QuestDB database server
- Prometheus to collect and store QuestDB metrics
- Loki to store logs from QuestDB
- Promtail to ship
logs to Loki
- Grafana to build dashboards with data from
Prometheus and Loki
These components work together as illustrated in the diagram below:
Prerequisites
To follow this tutorial, we will need the following tools. For our Kubernetes
cluster, we will be using kind (Kubernetes In
Docker) to test the installation and components in an isolated sandbox, although
you are free to use any Kubernetes flavor to follow along.
Getting started
Once you've
installed kind,
you can create a Kubernetes cluster with the following command:
kind create cluster
This will spin up a single-node Kubernetes cluster inside a Docker container and
also modify your current kubeconfig context to point kubectl to the
cluster's API server.
QuestDB
QuestDB endpoint
QuestDB exposes an HTTP metrics endpoint that can be scraped by Prometheus. This
endpoint, on port 9003, will return a wide variety of QuestDB-specific metrics
including query, memory usage, and performance statistics. A full list of
metrics can be found in the QuestDB docs.
Helm installation
QuestDB can be installed using Helm. You
can add the official Helm repo to your registry by running the following
commands:
helm repo add questdb https://helm.questdb.io/
helm repo update
This is only compatible with the Helm chart version 0.25.0 and higher. To
confirm your QuestDB chart version, run the following command:
helm search repo questdb
Before installing QuestDB, we need to enable the metrics endpoint. To do this,
we can override the QuestDB server configuration in a values.yaml file:
<<EOF > questdb-values.yaml
---
metrics:
  enabled: true
EOF
Once you've added the repo, you can install QuestDB in the default namespace:
helm install -f questdb-values.yaml questdb questdb/questdb
To test the installation, you can make an HTTP request to the metrics endpoint.
First, you need to create a Kubernetes port forward from the QuestDB pod to your
localhost:
export QUESTDB_POD_NAME=$(kubectl get pods --namespace default -l "app.kubernetes.io/name=questdb,app.kubernetes.io/instance=questdb" -o jsonpath="{.items[0].metadata.name}")
kubectl --namespace default port-forward $QUESTDB_POD_NAME 9003:9003
Next, make a request to the metrics endpoint:
curl http://localhost:9003/metrics
You should see a variety of Prometheus metrics in the response:
# TYPE questdb_json_queries_total counter
questdb_json_queries_total 0

# TYPE questdb_json_queries_completed_total counter
questdb_json_queries_completed_total 0

...
Prometheus
Now that we've exposed our metrics HTTP endpoint, we can deploy a
Prometheus instance to scrape the endpoint and store
historical data for querying.
Helm installation
Currently, the recommended way of installing Prometheus is using the
official Helm chart. You
can add the Prometheus chart to your local registry in the same way that we
added the QuestDB registry above:
helm repo add prometheus-community https://prometheus-community.github.io/helm-charts
helm repo update
As of this writing, we are using the Prometheus chart version 19.0.1 and app
version v2.40.5
Configuration
Before installing the chart, we need to configure Prometheus to scrape the
QuestDB metrics endpoint. To do this, we will need to add our additional scrape
configs to a prom-values.yaml file:
<<EOF > prom-values.yaml
---
extraScrapeConfigs: |
  - job_name: questdb
    metrics_path: /metrics
    scrape_interval: 15s
    scrape_timeout: 5s
    static_configs:
      - targets:
        - questdb.default.svc.cluster.local:9003
EOF
This config will make Prometheus scrape our QuestDB metrics endpoint every 15
seconds. Note that we are using the internal
service URL
provided to us by Kubernetes, which is only available to resources inside the
cluster.
We're now ready to install the Prometheus chart. To do so, you can run the
following command:
helm install -f prom-values.yaml prometheus prometheus-community/prometheus
It may take around a minute for the application to become responsive as it sets
itself up inside the cluster. To validate that the server is scraping the
QuestDB metrics, we can query the Prometheus server for a metric. First, we need
to open up another port forward:
export PROM_POD_NAME=$(kubectl get pods --namespace default -l "app=prometheus,component=server" -o jsonpath="{.items[0].metadata.name}")
kubectl --namespace default port-forward $PROM_POD_NAME 9090
Now we can run a query for available metrics after waiting for a minute or so.
We are using jq to filter the output to only
the QuestDB metrics:
curl -s http://localhost:9090/api/v1/label/__name__/values | jq -r '.data[] | select( . | contains("questdb_"))'
You should see a list of QuestDB metrics returned:
questdb_commits_total
questdb_committed_rows_total
...
Loki
Metrics are only part of the application support story. We still need a way to
aggregate and access application logs for better insight into QuestDB's
performance and behavior. While kubectl logs is fine for local development and
debugging, we will eventually need a production-ready solution that does not
require the use of admin tooling. We will use Grafana's
Loki, a scalable open-source solution that has
tight Kubernetes integration.
Helm installation
Like the other components we worked with, we will also be installing Loki using
an official Helm chart,
loki-stack.
The loki-stack helm chart includes Loki, used as the log database, and
Promtail, a log
shipper that is used to populate the Loki database.
First, lets add the chart to our registry:
helm repo add grafana https://grafana.github.io/helm-charts
helm repo update
Loki and Promtail are both enabled out of the box, so all we have to do is
install the Helm chart without even supplying our own values.yaml.
helm install loki grafana/loki-stack
After around a minute or two, the application should be ready to go. To test
that Promtail is shipping QuestDB logs to Loki, we first need to generate a few
logs on our QuestDB instance. We can do this by curling the QuestDB HTTP
frontend to generate a few INFO-level logs. This is exposed on a different
port than the metrics endpoint, so we need to open up another port forward
first.
# Open up the port forward
export QUESTDB_POD_NAME=$(kubectl get pods --namespace default -l "app.kubernetes.io/name=questdb,app.kubernetes.io/instance=questdb" -o jsonpath="{.items[0].metadata.name}")
kubectl --namespace default port-forward $QUESTDB_POD_NAME 9000:9000
Now navigate to http://localhost:9000, which should point to the QuestDB HTTP frontend. Your browser should make a request
that causes QuestDB to emit a few INFO-level logs.
You can query Loki to check if Promtail picked up and shipped those logs. Like the other components, we need to set up a port forward to access the
Loki REST API before running the query.
export LOKI_POD=$(kubectl get pods --namespace default -l "name=loki,app=loki" -o jsonpath="{.items[0].metadata.name}")
 kubectl --namespace default port-forward $LOKI_POD 3100:3100
Now, you can run the following
LogQL query against the Loki
server to return these logs. By default, Loki will look for logs at most an hour
old. We will also be using jq to filter the response data.
curl -s -G --data-urlencode 'query={pod="questdb-0"}' http://localhost:3100/loki/api/v1/query_range | jq '.data.result[0].values'
You should see a list of logs with timestamps that correspond to the logs from
the above sample:
[
  [
    "1670359425100049380",
    "2022-12-13T20:43:45.099494Z I http-server disconnected [ip=127.0.0.1, fd=23, src=queue]"
  ],
  [
    "1670359425099842047",
    "2022-12-13T20:43:45.099278Z I http-server scheduling disconnect [fd=23, reason=12]"
  ],
  ...
Grafana
Now that we have all of our observability components set up, we need an easy way
to aggregate our metrics and logs into meaningful and actionable dashboards. We
will install and configure Grafana inside
your cluster to visualize your metrics and logs in one easy-to-use place.
Helm Installation
The loki-stack chart makes this very easy for us to do. We just need to enable
Grafana by customizing the chart's values.yaml and upgrading it.
<<EOF > loki-values.yaml
---
grafana:
  enabled: true
EOF
With this setting enabled, not only are we installing Grafana, but we are also
registering Loki as a data source in Grafana to save us the extra work.
Now we can upgrade our Loki stack to include Grafana:
helm upgrade -f loki-values.yaml loki grafana/loki-stack
To get the admin password for Grafana, you can run the following command:
kubectl get secret --namespace default loki-grafana -o jsonpath="{.data.admin-password}" | base64 --decode ; echo
And to access the Grafana frontend, you can use a port forward:
kubectl port-forward --namespace default service/loki-grafana 3000:80
Configuration
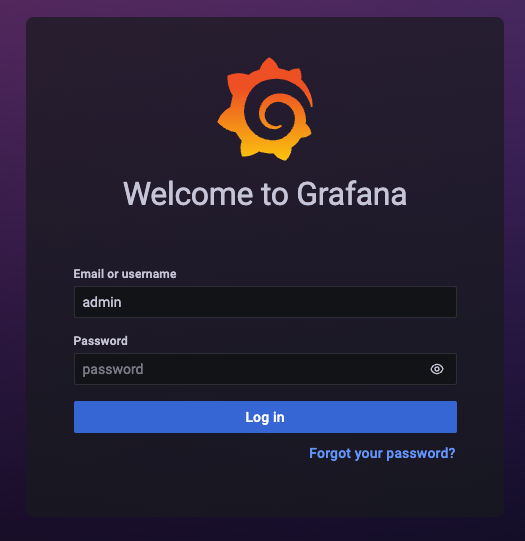
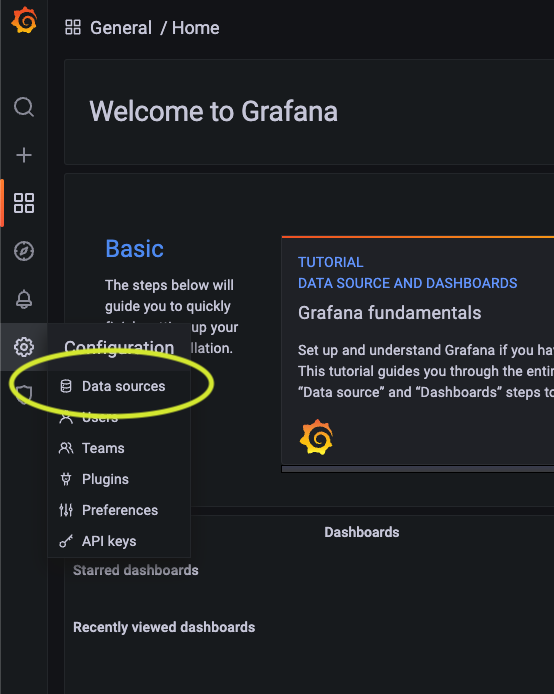
First navigate to http://localhost:3000 in your browser. You can log in using
the username admin and the password that you obtained in the previous step.
Once you've logged in, use the sidebar to navigate to the "data sources" tab:
Here, you can see that the Loki data source is already registered for us:
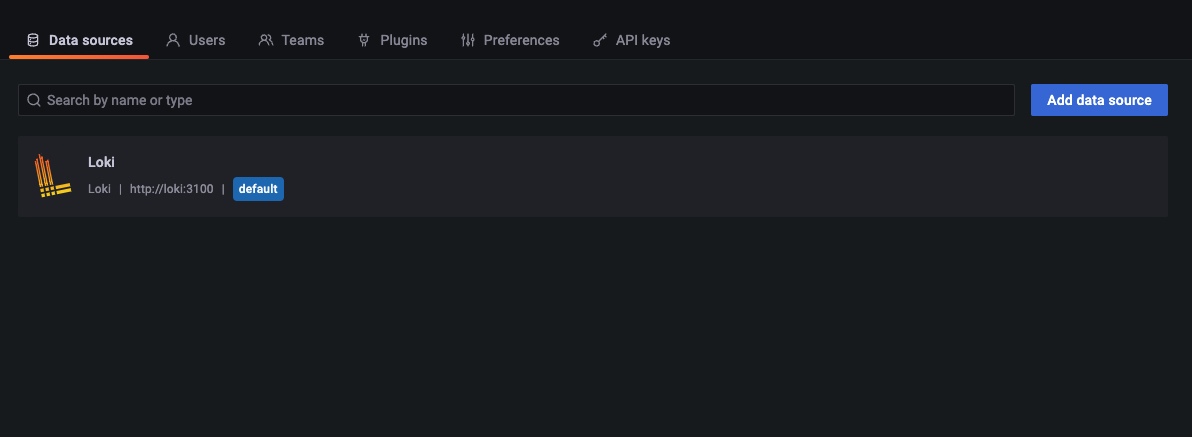
We still need to add our Prometheus data source. Luckily, Grafana makes this
easy for us.
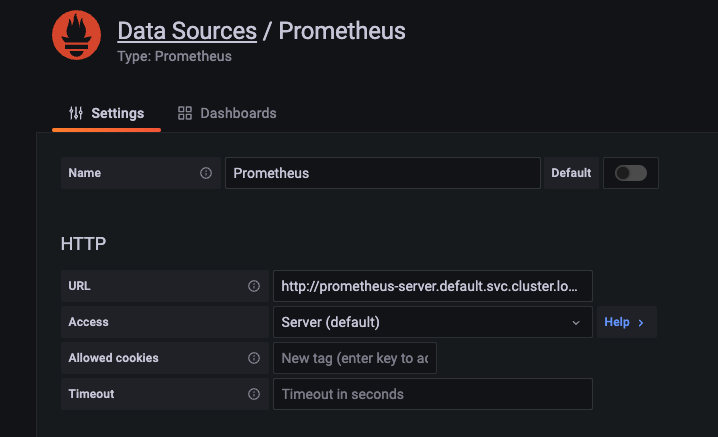
Click "Add Data Source" in the upper right and select "Prometheus". From here,
the only thing you need to do is enter the internal cluster URL of your
Prometheus server's Service:
http://prometheus-server.default.svc.cluster.local. Scroll down to the bottom,
click "Save & test", and wait for the green checkmark popup in the right corner.
Now you're ready to create dashboards with QuestDB metrics and logs!
Conclusion
I have provided a step-by-step tutorial to install and deploy QuestDB with a
monitoring infrastructure in a Kubernetes cluster. While there may be additional
considerations to make if you want to improve the reliability of the monitoring
components, you can get very far with a setup just like this one. Here are a few
ideas:
If you like this content, we'd love to know your thoughts! Feel free to share
your feedback or just come and say hello in the
QuestDB Community Slack.